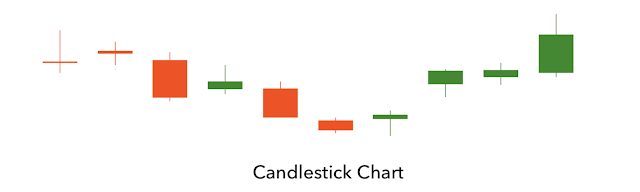
Candlestick Chart
A candlestick chart is a type of price chart used in technical analysis that displays an asset’s open, high, low, and closing prices over a specific time period.
Definition
A candlestick chart is a financial chart that shows price movement using individual “candles,” each representing a defined time period. Every candle displays four key data points: the opening price, highest price, lowest price, and closing price.
The chart visually indicates whether prices rose or fell during the period through the candle’s body color and shape, making price behavior easier to interpret at a glance.
How It Works
Each candlestick consists of two main parts:
- Body: Represents the range between the opening and closing prices.
- Wicks (or shadows): Show the highest and lowest prices reached during the period.
If the closing price is higher than the opening price, the candle is typically shown in green. If the closing price is lower than the opening price, the candle is typically shown in red. These visual cues reflect price direction and market sentiment for that time frame.
Why the Term Matters
Candlestick charts matter because they condense price data into a clear visual format that highlights price movement, volatility, and sentiment. This makes them a foundational tool in technical analysis and market observation across asset classes.
Related Concepts
- Open, high, low, close (OHLC)
- Technical analysis
- Price action
- Chart patterns
- Market sentiment
FAQs
What information does a candlestick chart show?
A candlestick chart shows the opening, highest, lowest, and closing prices for an asset over a specific time period.
Why are candlestick charts color-coded?
Candlestick charts use color to show whether the closing price was higher or lower than the opening price.
What does the body of a candlestick represent?
The body represents the price range between the opening and closing prices.
What do candlestick wicks indicate?
Candlestick wicks indicate the highest and lowest prices reached during the time period.
Where did candlestick charts originate?
Candlestick charts originated in Japan, where they were first used by rice traders to track price movement and momentum.
This article was created with AI assistance and reviewed by an editor. For more information, please refer to our Terms of Use.
Risk Disclosure
All content is provided for educational purposes only and does not constitute investment advice. Trading involves risk, and past performance is not indicative of future results. Please review our full Risk Disclosure for additional details.
Explore the SharperTrades Academy
For readers who want to deepen their understanding of market structure, risk management, and price behavior, explore the SharperTrades Academy, where we publish clear, evergreen explanations designed to support ongoing learning.