Bar Chart
A bar chart is a price chart that displays the open, high, low, and close of an asset for a specific time period using individual price bars.
Definition
A bar chart is a financial chart composed of vertical bars that represent price movement over a defined time interval. Each bar shows key price levels for that period.
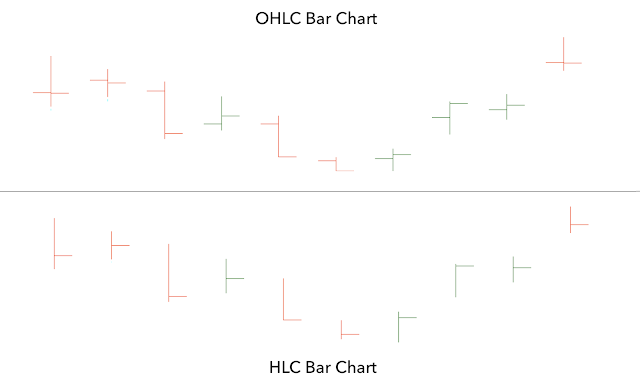
When a bar displays open, high, low, and close prices, it is known as an OHLC bar chart. If it displays only high, low, and close prices, it is called an HLC bar chart.
How It Works
Each bar represents one time period, such as a minute, day, week, or month. The vertical line shows the range between the highest and lowest prices during that period.
Small horizontal lines indicate the opening price on the left and the closing price on the right. Bar color commonly reflects whether the closing price was higher or lower than the opening price.
Why the Term Matters
Bar charts are a foundational tool in technical analysis for visualizing price movement and volatility. They provide a standardized way to view price behavior across different timeframes.
Understanding bar charts helps explain how market prices are recorded, compared, and interpreted over time.
Related Concepts
- OHLC chart
- HLC chart
- Candlestick chart
- Price volatility
- Timeframe
- Technical analysis
FAQs
What is a bar chart in trading?
A bar chart is a price chart that shows the open, high, low, and close of an asset for each time period.
What information does each bar represent?
Each bar represents price movement over a specific time interval, including the highest and lowest prices reached.
What is the difference between an OHLC and HLC bar chart?
An OHLC bar chart shows open, high, low, and close prices, while an HLC bar chart shows only high, low, and close prices.
What does the color of a bar indicate?
The bar color typically indicates whether the closing price was higher or lower than the opening price.
How are bar charts different from candlestick charts?
Bar charts and candlestick charts show the same price data, but candlestick charts use a filled body instead of horizontal lines to display open and close prices.
This article was created with AI assistance and reviewed by an editor. For more information, please refer to our Terms of Use.
Risk Disclosure
All content is provided for educational purposes only and does not constitute investment advice. Trading involves risk, and past performance is not indicative of future results. Please review our full Risk Disclosure for additional details.
Explore the SharperTrades Academy
For readers who want to deepen their understanding of market structure, risk management, and price behavior, explore the SharperTrades Academy, where we publish clear, evergreen explanations designed to support ongoing learning.