Fibonacci Retracement
Definition
Fibonacci retracement is a technical analysis indicator based on the Fibonacci sequence, a series of continuously growing numbers where each number equals the sum of the two preceding numbers.
The indicator uses horizontal lines to identify potential support and resistance levels. These levels show how much of a previous price move has been retraced using percentage-based measurements.
Key Takeaways
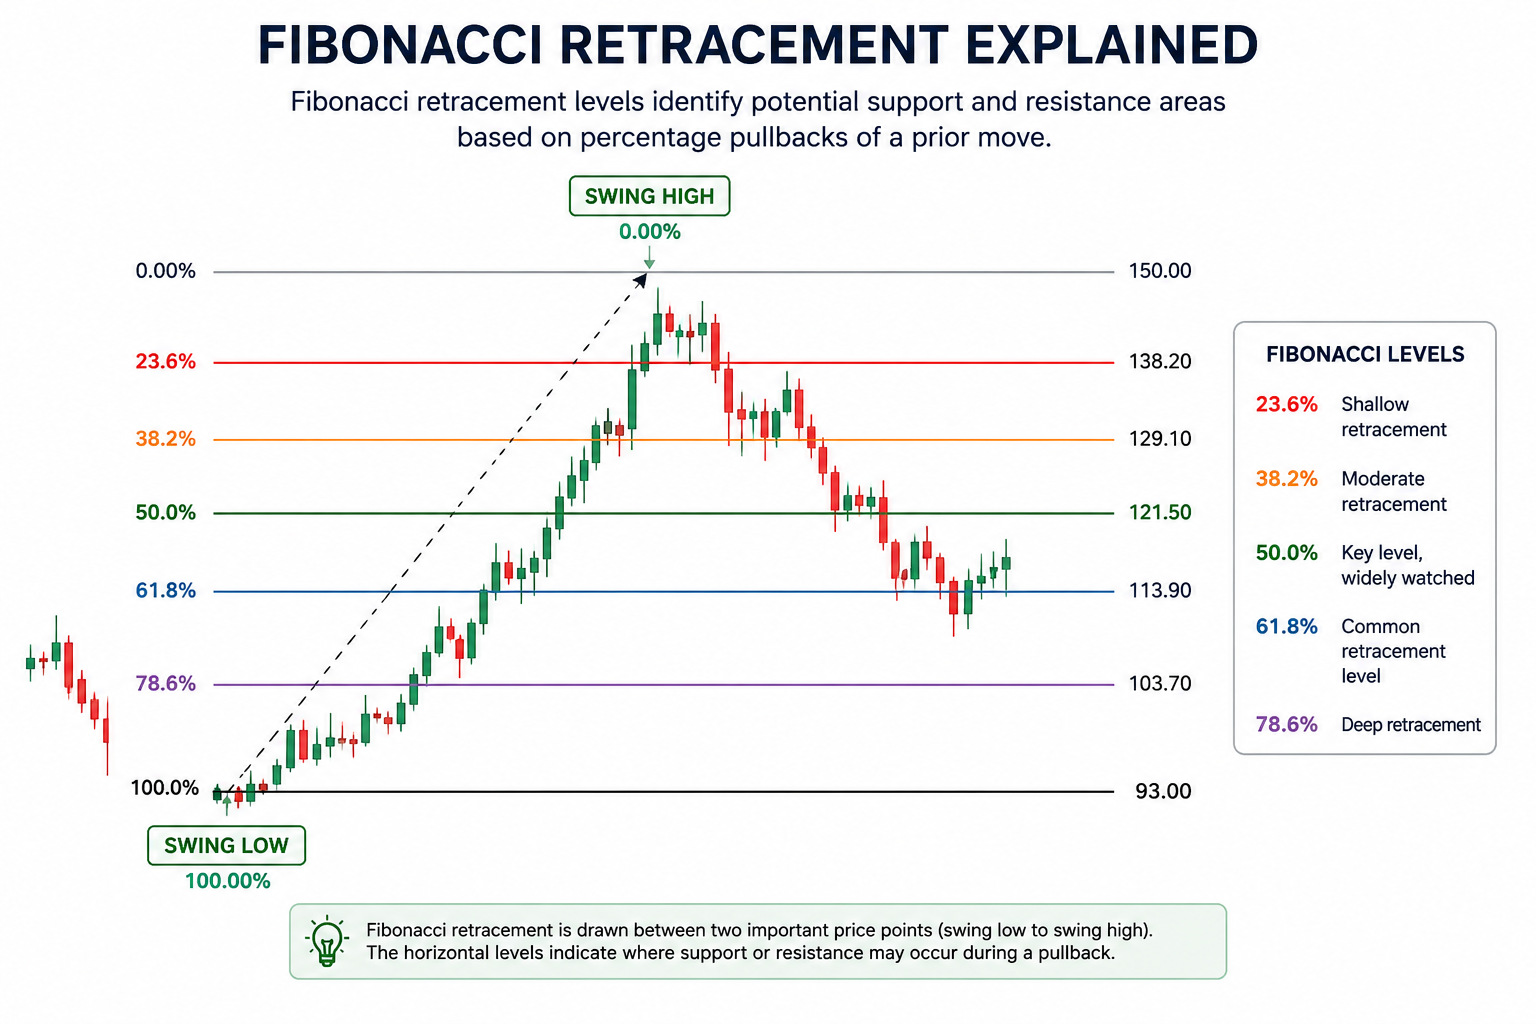
- Fibonacci retracement levels are used to identify potential support and resistance areas.
- The indicator measures how much of a previous price move has retraced.
- Common retracement levels include 23.6%, 38.2%, 50%, 61.8%, and 78.6%.
What Is Fibonacci Retracement?
Fibonacci retracement is an indicator that plots horizontal levels between two important price points, such as a high and a low.
These levels are based on percentages connected to the Fibonacci sequence. The percentages represent how much of the previous move the price has retraced.
How Fibonacci Retracement Levels Work
The indicator creates levels between two selected price points. Traders commonly apply the tool after a noticeable upward or downward price movement.
Each retracement level represents a percentage of the prior move.
Common Fibonacci Retracement Levels
The commonly used Fibonacci retracement levels are:
- 23.6%
- 38.2%
- 50%
- 61.8%
- 78.6%
Among these levels, the 50% retracement ratio is one of the most widely utilized.
How Fibonacci Retracement Is Applied
The indicator can be drawn between any two important price points, including a market high and a market low.
Once those points are selected, the Fibonacci retracement levels are automatically created between them.
Support and Resistance Areas
The horizontal levels generated by the indicator are used to identify areas where support and resistance may occur.
These levels are commonly monitored during price retracements within a broader market move.
Fibonacci Retracement in Market Context
Fibonacci retracement is part of technical analysis and is used to study price movement within financial markets.
By measuring how much a price has retraced from a previous move, the indicator provides a structured way to observe potential support and resistance levels between significant price points.
Conclusion
Fibonacci retracement is a percentage-based technical analysis tool derived from the Fibonacci sequence. It is used to identify possible support and resistance levels during price retracements.
The indicator is created by selecting two important price points, allowing retracement levels to form between the high and low of a move.
FAQs
What is Fibonacci retracement?
Fibonacci retracement is a technical analysis indicator that uses horizontal percentage levels to identify potential support and resistance areas.
What is the Fibonacci sequence?
The Fibonacci sequence is a series of continuously growing numbers where each number equals the sum of the two numbers before it.
What do Fibonacci retracement percentages represent?
Fibonacci retracement percentages show how much of a previous price move has been retraced.
What are the common Fibonacci retracement levels?
The common Fibonacci retracement levels are 23.6%, 38.2%, 50%, 61.8%, and 78.6%.
Why is the 50% retracement level important?
The 50% retracement level is important because it is one of the most commonly utilized Fibonacci ratios.
How are Fibonacci retracement levels drawn?
Fibonacci retracement levels are drawn between two important price points, such as a high and a low.
This article was created with AI assistance and reviewed by an editor. For more information, please refer to our Terms of Use.
Risk Disclosure
All content is provided for educational purposes only and does not constitute investment advice. Trading involves risk, and past performance is not indicative of future results. Please review our full Risk Disclosure for additional details.
Explore the SharperTrades Academy
For readers who want to deepen their understanding of market structure, risk management, and price behavior, explore the SharperTrades Academy, where we publish clear, evergreen explanations designed to support ongoing learning.